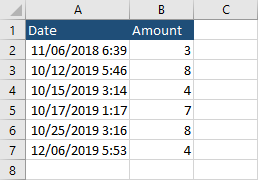
In Excel, if you create a table, dates or times will be displayed on the X-axis. But there are situations where the data won’t look the way we want.
Here’s an example.
You have to remember that your dates have to be sorted, otherwise, they will be displayed inside the horizontal axis in the incorrect order (the same as inside the table).
To sort dates, click the date column and navigate to Home >> Editing >> Sort & Filter and sort them from oldest to newest.
Now, we are going to insert a line chart. First, click any cell inside your table and navigate to Insert >> Charts >> Insert Line or Area Chart >> Line.
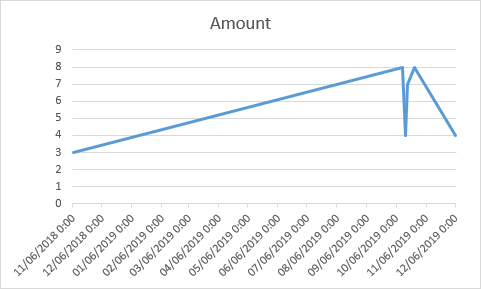
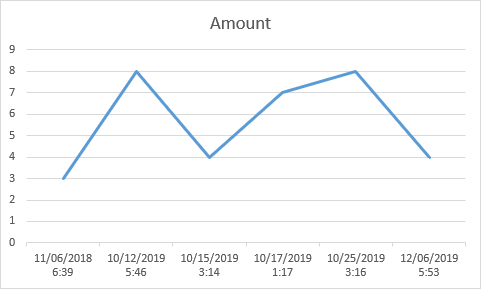
This chart doesn’t look right.
Displaying date on the horizontal axis
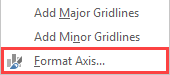
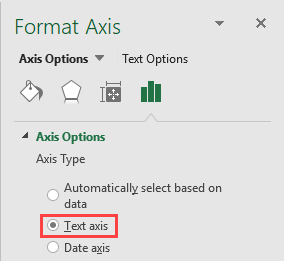
In order to display dates and times correctly, right-click the horizontal axis and choose Format Axis.
Inside the Format Axis options, change Automatically select based on data to Text axis.
This is going to change our horizontal axis and display values as shown on the image below.