Pivot Tables are amazingly useful and can help us present our data in many ways. One of the problems that people may have when dealing with Pivot Tables is not knowing how to present your data set on different sheets from Pivot Table if you have criteria for which you need various sheets to be created.
We will explain what we mean by that and show how to create multiple sheets from Pivot Table in the example below.
Create Multiple Sheets from Pivot Table
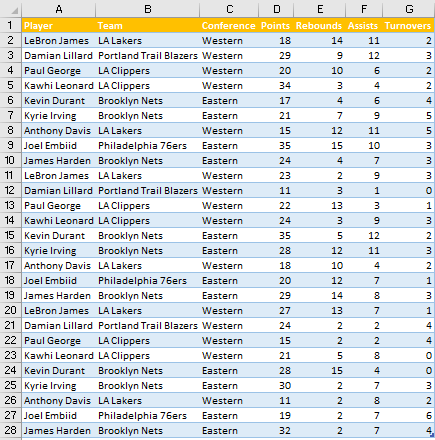
For our example, we will use the list of NBA players, their clubs, conferences, and statistics for several nights.
We will create Pivot Table from this data set in another sheet and call this sheet simply „Pivot Table“.
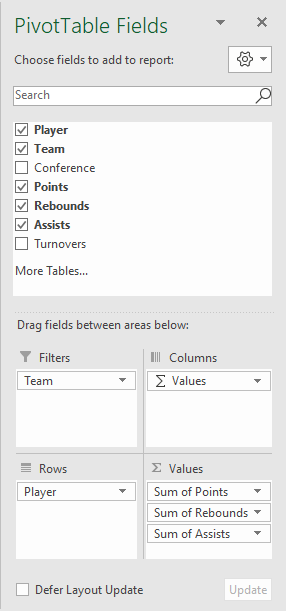
In our table, we will put Teams in Filter field, Players in Row field, and points, rebounds, and assists in values:
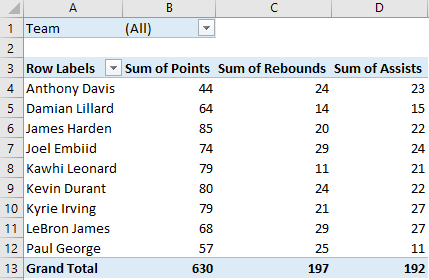
Our table looks like this:
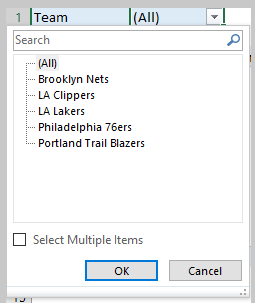
Now, we know that in our filter fields (cell B1) we have various teams:
It would be pretty neat if we could create a sheet for each team with the data that we have put in our fields.
Luckily, Excel has this option automated.
After we select Pivot Table, we will go to PivotTable Analyze >> PivotTable >> Options >> Show Report Filter Pages:
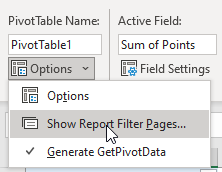
When we click on it, we will be presented with the following window:

We will only have the option for our teams, as this is the only column that we have on Filters fields.
If we had, for example, Conference in Filter fields as well, we would have two options, as seen in a picture below:

Since we want to create sheets for each team, we will select the Team column and click OK.
All of the sheets for teams will be created:

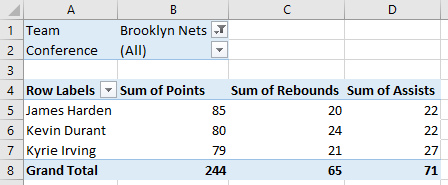
Furthermore, our table will have the same filters as we originally defined. For example, this is how our Brooklyn Nets pivot table looks:
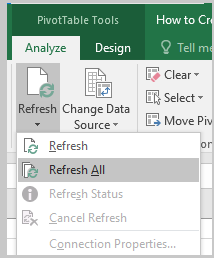
If we are to make any changes in our original table, all we have to do to update all the tables is simply click on any table and then go to Analyze >> Refresh >> Refresh All: