You can use the Data tab on the Ribbon when you manipulate data. Options on this tab allow you to import, transform, sort, and split data.
Get & Transform Data
In this part of the Data tab, you can load data from different file formats, such as:
- text files
- CSV
- XML
- JSON
You can also get data from the database. Here, you will find the most popular types of databases:
- Microsoft Access
- MySQL
- PostgreSQL
- Oracle
There are also a few other databases that are less popular but also used in many places.
There are a few other places, you can get data, such as the Microsoft cloud called Azure. Click the Get Data Dropdown list to reveal all of them.
You can also load data from a website by choosing From Web and inserting a URL.
Querries & Connections
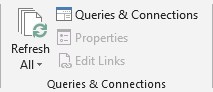
With the Refresh All button, you can refresh all data coming from the external sources.
Click Queries & Connections to display all connections from the outside sources to your workbook.
The Properties option is enabled, only if you select a cell that is populated with an external connection.
Sort & Filter
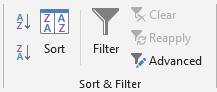
This area is similar to the Editing area on the Home tab. You have options to sort and filter data.
What you do have here, that is not present on the Home tab, is the Advanced Filter with additional options to filter.
Data Tools
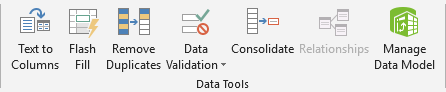
Here, you can find such an option, as Text to Columns, to split data from one column to multiple, by specifying a delimiter, such as a comma, tab, space, etc.
Flash Fill uses a complicated algorithm to determine what data to place inside cells, by analyzing surrounding cells.
The next option, called Remove Duplicates keeps unique values.
Under the Data Validation tab, you can specify the criteria that have to be met for the particular cells. You can choose whether you want decimal values, text, date, etc. You can also determine ranges for values, or length for text and a few other options.
The Consolidate option merges the same rows and consolidates the data in the chosen way. For example, you can have a list of people and the amount they earned. So the names are used multiple times. With this option, you can display the name once, with the summed earnings.
Forecast
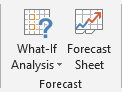
Here, you have all the options such as Goal Seek, that calculates the value of a single input and should be used when there is one unknown variable.
The Manage Data Model option opens the Power Pivot window. Before you can use this feature, you must enable the Data Analysis add-ins.
Outline
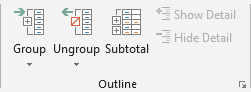
This part of the Data tab is used to group and ungroup rows and columns. The Subtotal feature lets you group the whole table and calculate rows of related data, by inserting subtotals and grand totals.